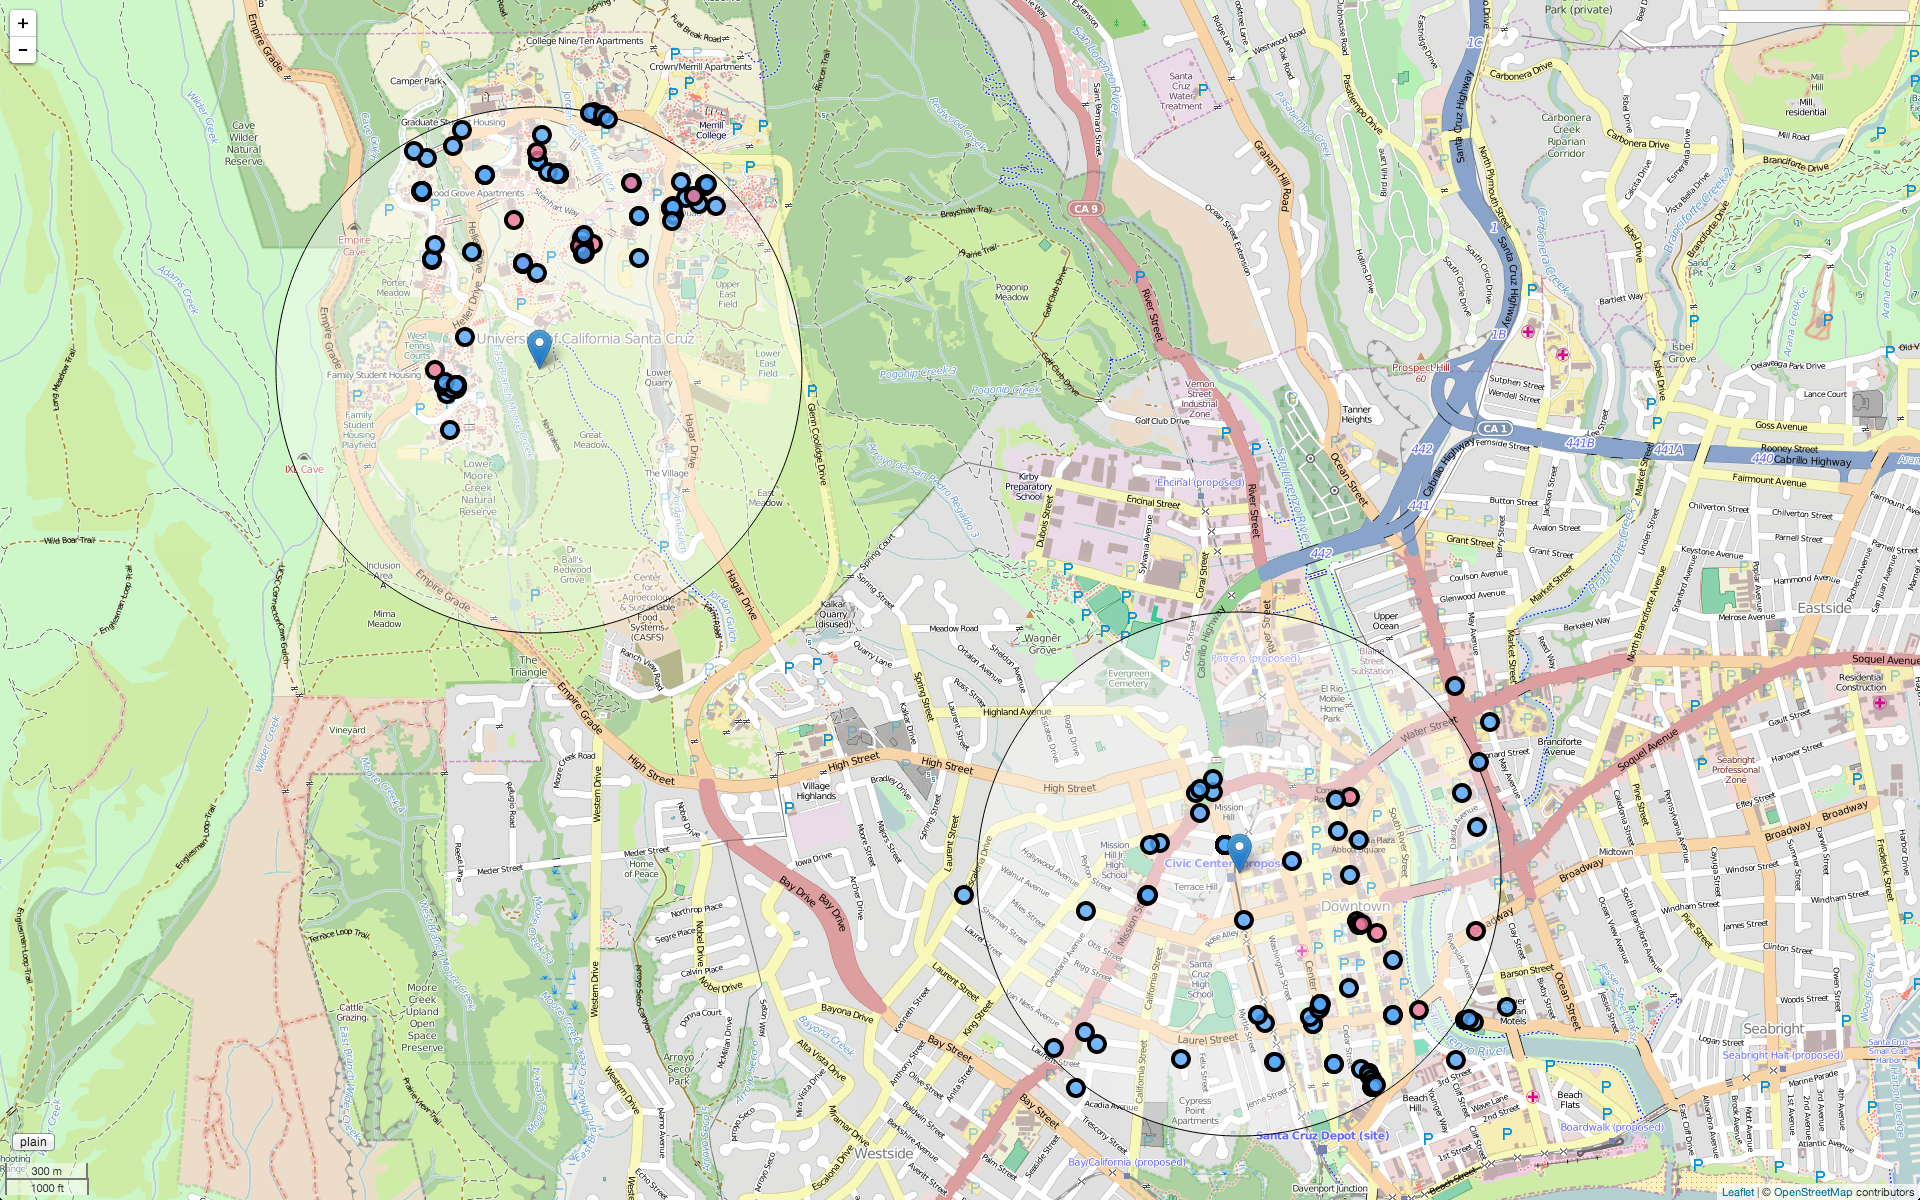
Vizit creates mobile-friendly visualizations for geotagged data using HTML5 and CSS3. It retrieves GeoJSON files via AJAX and produces maps using Leaflet.js and OpenStreetMap. See the documentation of OGRe, a complemental project, for more on the history and architecture of vizit.
To get Vizit, use one of the following methods:
- GitHub (recommended)
- git
$ git clone https://github.com/openfusion-dev/vizit.gitTo use Vizit, you must open index.html in your favorite browser.
Development and testing is done in the latest version of Google Chrome, but Vizit uses HTML5 Boilerplate, Twitter Bootstrap, Modernizr, and more to accommodate as many devices and browsers as possible.
GeoJSON data is specified as a GET parameter like so: /index.html?data=example.geojson
Vizit looks for keywords in the properties of Feature objects. These keywords affect the look of the resulting visualization. Each property is listed alphabetically below.
image-- content to be displayed in a popup (Base64-encoded string)marker-- string signifying what type of marker to create ("Marker"and"CircleMarker"are currently supported.)markerOptions-- object containing Leaflet Marker Options or Leaflet Path Options for styling the Marker or CircleMarker object, respectively, that represents the Feature (depending on the value ofmarker)radius-- floating point number representing an area around the Feature's Geometry (in meters)radiusOptions-- object containing Leaflet Path Options for styling the circle that represents the radius (radiusOptionsare only rendered ifradiusis specified.)related-- GeoJSON FeatureCollection of locally-related datasource-- origin oftextandimagecontenttext-- string to be displayed in a popup (Unicode encoding supported)time-- string produced byJSON.stringify()(ISO 8601 format)