-
-
Notifications
You must be signed in to change notification settings - Fork 409
Next release #1660
New issue
Have a question about this project? Sign up for a free GitHub account to open an issue and contact its maintainers and the community.
By clicking “Sign up for GitHub”, you agree to our terms of service and privacy statement. We’ll occasionally send you account related emails.
Already on GitHub? Sign in to your account
Merged
Merged
Next release #1660
Changes from all commits
Commits
Show all changes
7 commits
Select commit
Hold shift + click to select a range
dfd7256
Docs
jokob-sk 00bb943
Merge branch 'next_release' of github.com:netalertx/NetAlertX into ne…
jokob-sk 12b104e
Device filters docs. link, and less verbose in-app notifications for …
jokob-sk 9875411
BE: better CRON validation regex #1659
jokob-sk f0cc4d1
Enhance carbon-copy behavior to prevent overwriting devPresentLastSca…
jokob-sk 721cdf0
Merge branch 'next_release' of https://github.com/netalertx/NetAlertX…
jokob-sk 62e4070
Fix typos in DEVICE_FILTERS.md and devices.php for clarity and consis…
jokob-sk File filter
Filter by extension
Conversations
Failed to load comments.
Loading
Jump to
Jump to file
Failed to load files.
Loading
Diff view
Diff view
There are no files selected for viewing
This file contains hidden or bidirectional Unicode text that may be interpreted or compiled differently than what appears below. To review, open the file in an editor that reveals hidden Unicode characters.
Learn more about bidirectional Unicode characters
| Original file line number | Diff line number | Diff line change |
|---|---|---|
| @@ -0,0 +1,159 @@ | ||
| ## Device List & Display Configuration | ||
|
|
||
| The **Devices** page is your primary view into what NetAlertX is monitoring. If devices are missing, unexpected devices appear, or the list doesn’t look the way you expect, the issue is often related to **filters**, **display settings**, or **device visibility configuration**. | ||
|
|
||
| This guide focuses on adjusting your view and troubleshooting common display-related issues. | ||
|
|
||
| --- | ||
|
|
||
| ## I Don’t See a Device I Expect in *My Devices* | ||
|
|
||
| If a device is missing from the **My Devices** list, work through these checks. | ||
|
|
||
| ### Check Active Filters | ||
|
|
||
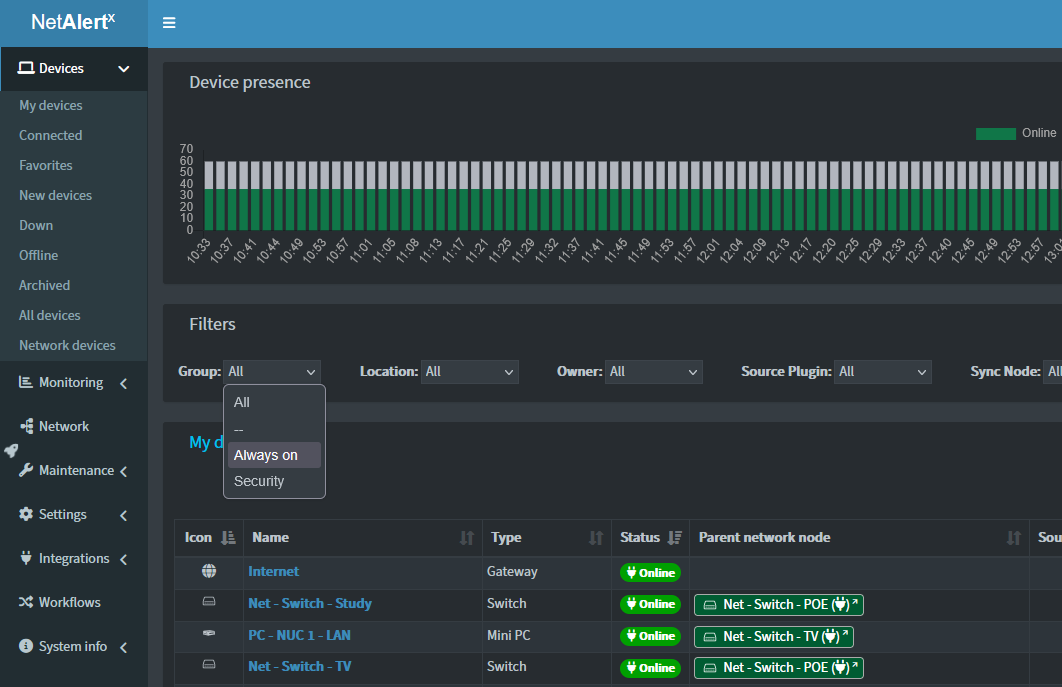
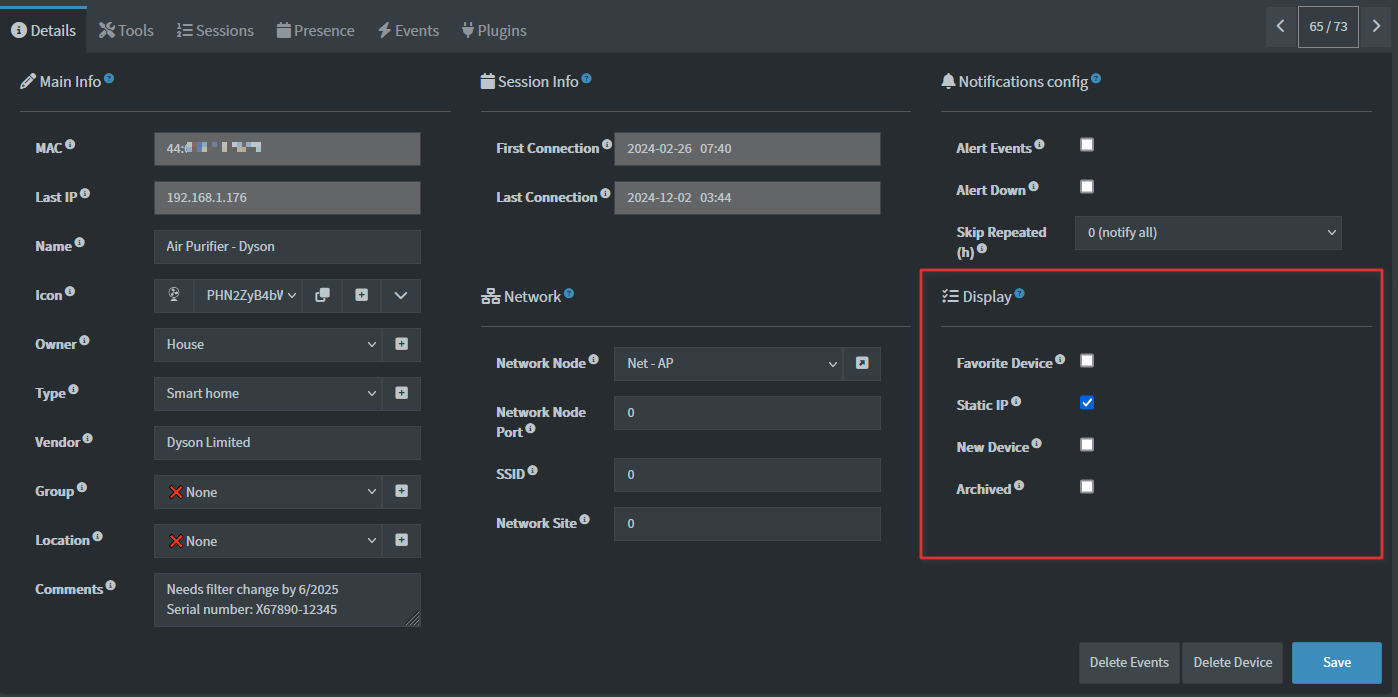
| The most common cause is that a filter is hiding the device. | ||
|
|
||
|  | ||
|
|
||
|  | ||
|
|
||
| Review any active: | ||
|
|
||
| * **Status filters** (Online / Offline / Down / Archived) | ||
| * **Location** filters | ||
| * **Owner / User** filters | ||
| * **Device Type** filters | ||
| * Search terms entered in the search box | ||
|
|
||
| Clear filters first, then reload the page and check again. | ||
|
|
||
| ### Check global filters | ||
|
|
||
| You can select devices of what statuses should be displayed in the My Devices view. This can be adjusted in the _Settings_ section - search for the `UI_MY_DEVICES` setting and verify that the statuses you want to show are selected. | ||
|
|
||
| --- | ||
|
|
||
| ### Check Whether the Device Is Hidden | ||
|
|
||
| Some devices may be excluded from normal views depending on configuration. | ||
|
|
||
| Examples include: | ||
|
|
||
| * Archived devices | ||
| * Devices marked as ignored (`NEWDEV_ignored_IPs` and `NEWDEV_ignored_MACs` settings) | ||
| * Virtual or relationship-only devices excluded from display (setting `UI_hide_rel_types`) | ||
| * Devices assigned to another user view or group | ||
|
|
||
| If the device exists in the database but is intentionally hidden, it may not appear in default lists. | ||
|
|
||
| --- | ||
|
|
||
| ### Confirm the Device Has Been Detected | ||
|
|
||
| If the device has never been scanned or synced into NetAlertX yet, it won’t appear in the UI. | ||
|
|
||
| Things to check: | ||
|
|
||
| * Is the device currently online? | ||
| * Has the network scan already run? | ||
| * Is the correct scan source enabled? | ||
| * If using sync/import, has the sync node completed successfully? | ||
|
|
||
| You can also trigger a manual scan and refresh the UI afterward. | ||
|
|
||
| --- | ||
|
|
||
| ### Refresh the UI Cache | ||
|
|
||
| Sometimes device data updates correctly in the backend but the browser view hasn’t refreshed yet. | ||
|
|
||
| Try: | ||
|
|
||
| * Clicking the **Reload** icon in the NetAlertX header | ||
| * Waiting for the next automatic refresh cycle | ||
| * Performing a hard browser refresh (`Ctrl+Shift+R` / `Cmd+Shift+R`) | ||
|
|
||
| The built-in **Reload** action is recommended over browser refresh because it clears the application’s internal cache, otherwise cache refresh might take a couple of minutes. | ||
|
|
||
| --- | ||
|
|
||
| ## Filtering Your Device View | ||
|
|
||
| Filters help narrow large device inventories into manageable views. | ||
|
|
||
| Common filtering options include: | ||
|
|
||
| | Filter | Use Case | | ||
| | --------------- | ----------------------------------------------------------- | | ||
| | **Status** | Show only Online, Offline, Down, New, or Archived devices | | ||
| | **Location** | View devices from a specific site or branch | | ||
| | **Device Type** | Show only servers, network gear, clients, IoT devices, etc. | | ||
| | **Owner/User** | Limit results to a specific user or device owner | | ||
| | **Search** | Find devices by hostname, IP address, MAC address, or label | | ||
|
|
||
| Filters can be combined, which is especially useful for large installations. | ||
|
|
||
| Example: | ||
|
|
||
| `Status = Down` + `Location = Sydney Office` | ||
|
|
||
| This shows only devices currently down at that site. Available filters can be configured via the `UI_columns_filters` setting. | ||
|
|
||
| --- | ||
|
|
||
| ## Related Display Settings | ||
|
|
||
| Several UI settings affect what appears in the device list. | ||
|
|
||
| ### Hidden Connections / Virtual Devices | ||
|
|
||
| You can hide non-essential relationships or virtual connections from the main view to reduce clutter. | ||
|
|
||
| Useful when: | ||
|
|
||
| * imported relationships create visual noise | ||
| * virtual devices aren’t relevant to daily monitoring | ||
| * you want a cleaner operational view | ||
|
|
||
| See the `UI_hide_rel_types` setting for details. | ||
|
|
||
| --- | ||
|
|
||
| ### Dashboard Block Visibility | ||
|
|
||
| If you’re using the dashboard alongside **Devices**, UI Settings allow you to disable blocks that aren’t useful for your workflow. | ||
|
|
||
| Common examples: | ||
|
|
||
| * Tiles | ||
| * Presence widgets | ||
| * Summary cards | ||
| * Relationship views | ||
|
|
||
| This can make the device list easier to focus on. | ||
|
|
||
| To configure the above check the `UI_shown_cards`, `UI_DEV_SECTIONS` and `UI_hide_empty` settings. | ||
|
|
||
| --- | ||
|
|
||
| ### Auto Refresh | ||
|
|
||
| If devices appear stale or statuses don’t update immediately, check **UI refresh settings** (`UI_REFRESH` setting). | ||
|
|
||
| A refresh interval between **60–120 seconds** is usually a good balance between responsiveness and browser performance. | ||
|
|
||
| --- | ||
|
|
||
| ## Quick Troubleshooting Checklist | ||
|
|
||
| Before digging deeper, run through this list: | ||
|
|
||
| * [ ] Clear all active filters | ||
| * [ ] Search by hostname, MAC address, or IP | ||
| * [ ] Confirm the device is not archived or hidden | ||
| * [ ] Trigger or verify a recent network scan | ||
| * [ ] Use the NetAlertX **Reload** icon to refresh the UI cache | ||
| * [ ] Check related UI visibility settings | ||
|
|
||
| If the device still doesn’t appear after these checks, review the scan/import logs to confirm it has been discovered successfully by NetAlertX. |
This file contains hidden or bidirectional Unicode text that may be interpreted or compiled differently than what appears below. To review, open the file in an editor that reveals hidden Unicode characters.
Learn more about bidirectional Unicode characters
This file contains hidden or bidirectional Unicode text that may be interpreted or compiled differently than what appears below. To review, open the file in an editor that reveals hidden Unicode characters.
Learn more about bidirectional Unicode characters
This file contains hidden or bidirectional Unicode text that may be interpreted or compiled differently than what appears below. To review, open the file in an editor that reveals hidden Unicode characters.
Learn more about bidirectional Unicode characters
This file contains hidden or bidirectional Unicode text that may be interpreted or compiled differently than what appears below. To review, open the file in an editor that reveals hidden Unicode characters.
Learn more about bidirectional Unicode characters
This file contains hidden or bidirectional Unicode text that may be interpreted or compiled differently than what appears below. To review, open the file in an editor that reveals hidden Unicode characters.
Learn more about bidirectional Unicode characters
Oops, something went wrong.
Oops, something went wrong.
Add this suggestion to a batch that can be applied as a single commit.
This suggestion is invalid because no changes were made to the code.
Suggestions cannot be applied while the pull request is closed.
Suggestions cannot be applied while viewing a subset of changes.
Only one suggestion per line can be applied in a batch.
Add this suggestion to a batch that can be applied as a single commit.
Applying suggestions on deleted lines is not supported.
You must change the existing code in this line in order to create a valid suggestion.
Outdated suggestions cannot be applied.
This suggestion has been applied or marked resolved.
Suggestions cannot be applied from pending reviews.
Suggestions cannot be applied on multi-line comments.
Suggestions cannot be applied while the pull request is queued to merge.
Suggestion cannot be applied right now. Please check back later.
Uh oh!
There was an error while loading. Please reload this page.