Lily Moreno is the director of marketing. She is in charge of a promoting the bike-share program at Cyclistic. The bike share program features 5800 bikes of multiple varieties and 600 docking stations in Chicago. Cyclistic’s users include riders who use the bikes casually, in single ride or full-day ride passes, and members with annual member access to the bikes. Moreno’s goal is to design marketing strategies to convert the casual riders into annual members. My goal is to analyze Cyclistic historical bike trip data to identify the differences between casual riders and annual members usage of the Cyclistic bikes.
The data is internal data from Cyclistic. This data is made available by the business and is credible information not gathered by other organizations. This data is exclusive to the brand and therefore does not carry the risk of data replication, data transfer or data manipulation. It consists of 12 CSV files each containing hundreds of thousands of bike trip logs. Each file represents 1 month from the past year. The data is divided into 13 columns: Ride ID, rideable type, start time and end time, start station and end station name, id, longitude and latitude, and the member type.
The .csv files were merged using CMD to create 4 quarterly data CSVs. The data was then imported into R studio where it underwent several steps in preparation for analysis. The columns were imported into R studio. The first step was comparing the columns. It was found that the date format for the fourth and third quarter data differed from the first and second. The necessary actions to create a new date column, day, week, and month, and year column, as well as ride length column were unique to the data to the first half of the year and the second half of the year. After generating this data, the columns were analyzed to ensure data quality. The duration and quantity of rides were then calculated and visualizations were exported along with CSV data for further analysis.
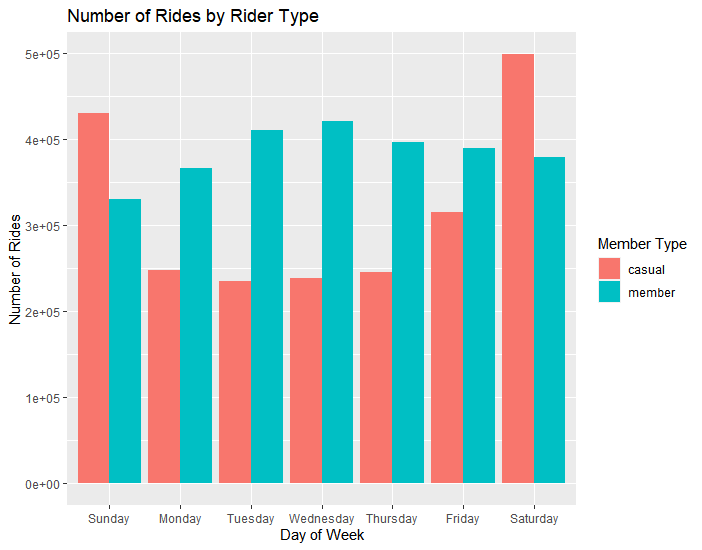
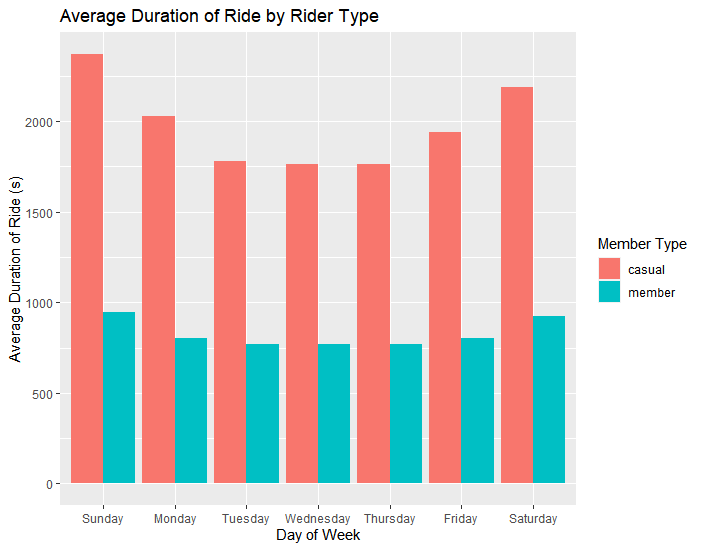
It was found that Members ride more times on weekdays and casual users ride more times on weekends. Casual users ride most on Saturday and least on Tuesday. Casual users go on longer rides than members. It is recomended that marketing campaign is launched on weekends and a discount incentive is given for longer rides. A way to support users who enjoy longer rides is recommended to win over casual users. This could including adding longer distance stops on maps.