Skip to content

elsa-a/data-visualisation

Folders and files

NameName
Last commit message
Last commit date

Latest commit

Β 

History

7 Commits
Β 
Β 

Repository files navigation

Data Visualisation with Tableau

Sentiment Analysis on Rick and Morty Scripts

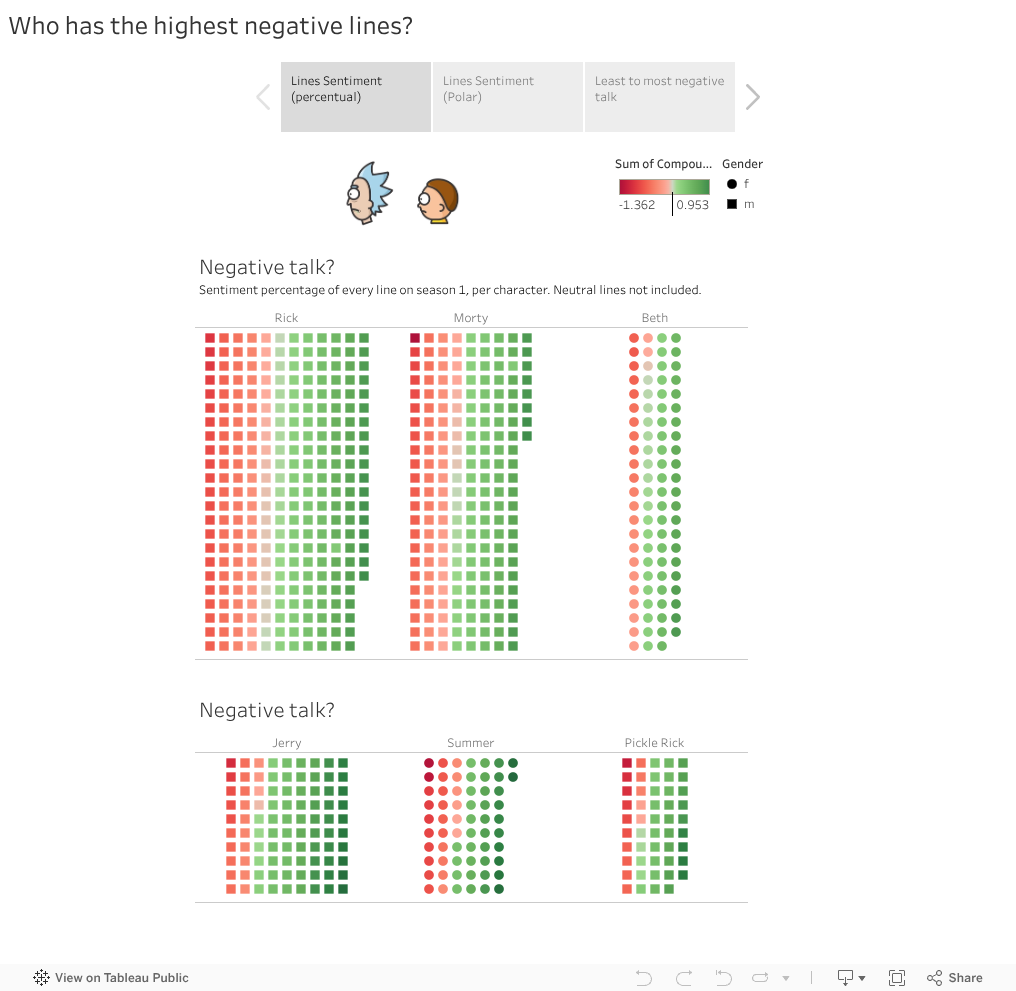
Finding the emotion or intent behind a piece of text is a complex task due to the intricacies of textual data. In this project I used NLTK and other python libraries to perform basic sentiment analysis on Rick and Morty Scripts.

Please note that github does not support the interactive features of Tableau, head to Tableau in the link below for the whole project:

🌟Link to the original visualisation on tableau

Link to the colab notebook where the data is processed.

Who has the highest negative lines?

Titanic Survivors visualisation using the Kaggle dataset

🌟Link to the original vis in Tableau

Who survived the Titanic?
<script type='text/javascript'> var divElement = document.getElementById('viz1674733110351'); var vizElement = divElement.getElementsByTagName('object')[0]; vizElement.style.width='1016px';vizElement.style.height='991px'; var scriptElement = document.createElement('script'); scriptElement.src = 'https://public.tableau.com/javascripts/api/viz_v1.js'; vizElement.parentNode.insertBefore(scriptElement, vizElement); </script>

About

🌟🌟 My Data Visualisations projects (Tableau)

Topics

Resources

Stars

Watchers

Forks

Releases

No releases published

Packages

No packages published