Using Python, SQLAlchemy , and Flask , analyze and visualize climate data as we prepare to open a surf shop.
W.Avy wants more information about temprature data trends for the month of June and December in Oahu ,inorder to determine if the Surf and ice cream shop bussiness is sustainable year round. i did generate the summary statistics for both Months and stored in a flat database file(.db/.sqlite)
- The three key differences in weather between June and December based on the ststistical overview of the data;
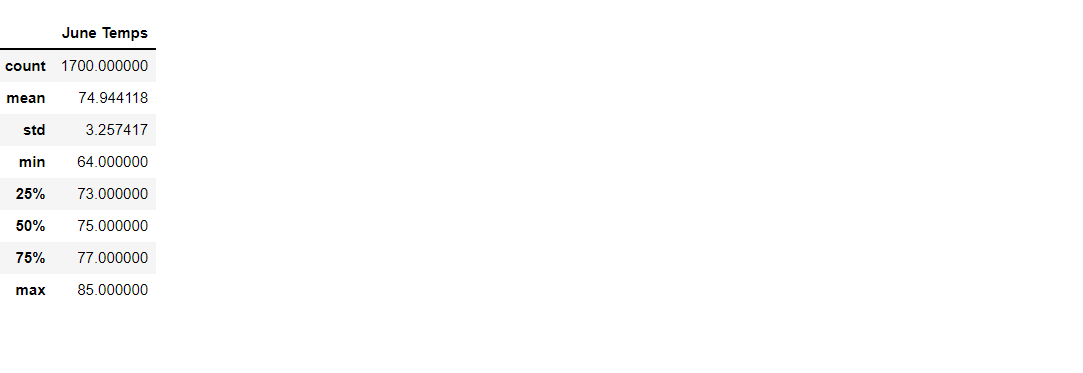
- There is a higher max temprature in June than December. However, with only the differece of 2 degrees.
- june also average leading temprature by less than 3 degrees
- june has a higher minimum temprature by 8 degrees
To access the analysis data, i have Used SQLAlchamy ORM , which allows me to Query the data by passing Python objects as queries.Then the data transformed within a python enviroment and analyzed in Summary Statistics.
June Temprature Summary Statistics
December Temprature Summary Statistics
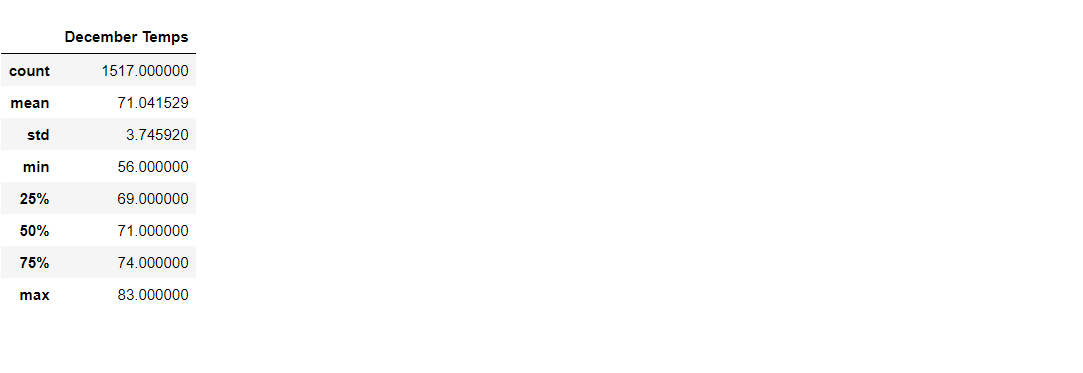
Through querying and analyzing the spread of weather for this data , it is safe to say that while December is colder but still possible to run a business focused on outdoor activities in Oahu even colder months.