If localtileserver saves you time, powers your work, or you need direct help, please consider supporting the project and my efforts:


Need to visualize a rather large (gigabytes+) raster? This is for you.
A Python package for serving tiles from large raster files in
the Slippy Maps standard
(i.e., /zoom/x/y.png) for visualization in Jupyter with ipyleaflet or folium.
Try it live on MyBinder: (more demos in
examples/)
Documentation: https://localtileserver.banesullivan.com/
Built on rio-tiler and FastAPI
- Launch a tile server for large geospatial images
- View local or remote raster files with
ipyleafletorfoliumin Jupyter - Band math expressions for on-the-fly computed imagery (e.g., NDVI)
- Per-band statistics and multiple image stretch modes
- Multiple output formats: PNG, JPEG, WebP, GeoTIFF, NPY
- Spatial subsetting via bounding box crops and GeoJSON masks
- STAC item support for multi-asset catalogs
- Xarray DataArray tile serving (NetCDF, Zarr, etc.)
- Virtual mosaics from multiple raster files
- View rasters with CesiumJS with the built-in web application
- Full REST API powered by FastAPI with auto-generated OpenAPI docs
Usage details and examples can be found in the documentation: https://localtileserver.banesullivan.com/
The following is a minimal example to visualize a local raster file with
ipyleaflet:
import localtileserver as lts
from ipyleaflet import Map

# First, create a tile server from local raster file
client = lts.open('path/to/geo.tif')

# Create ipyleaflet tile layer from that server
t = lts.get_leaflet_tile_layer(client)

m = Map(center=client.center(), zoom=client.default_zoom)
m.add(t)
m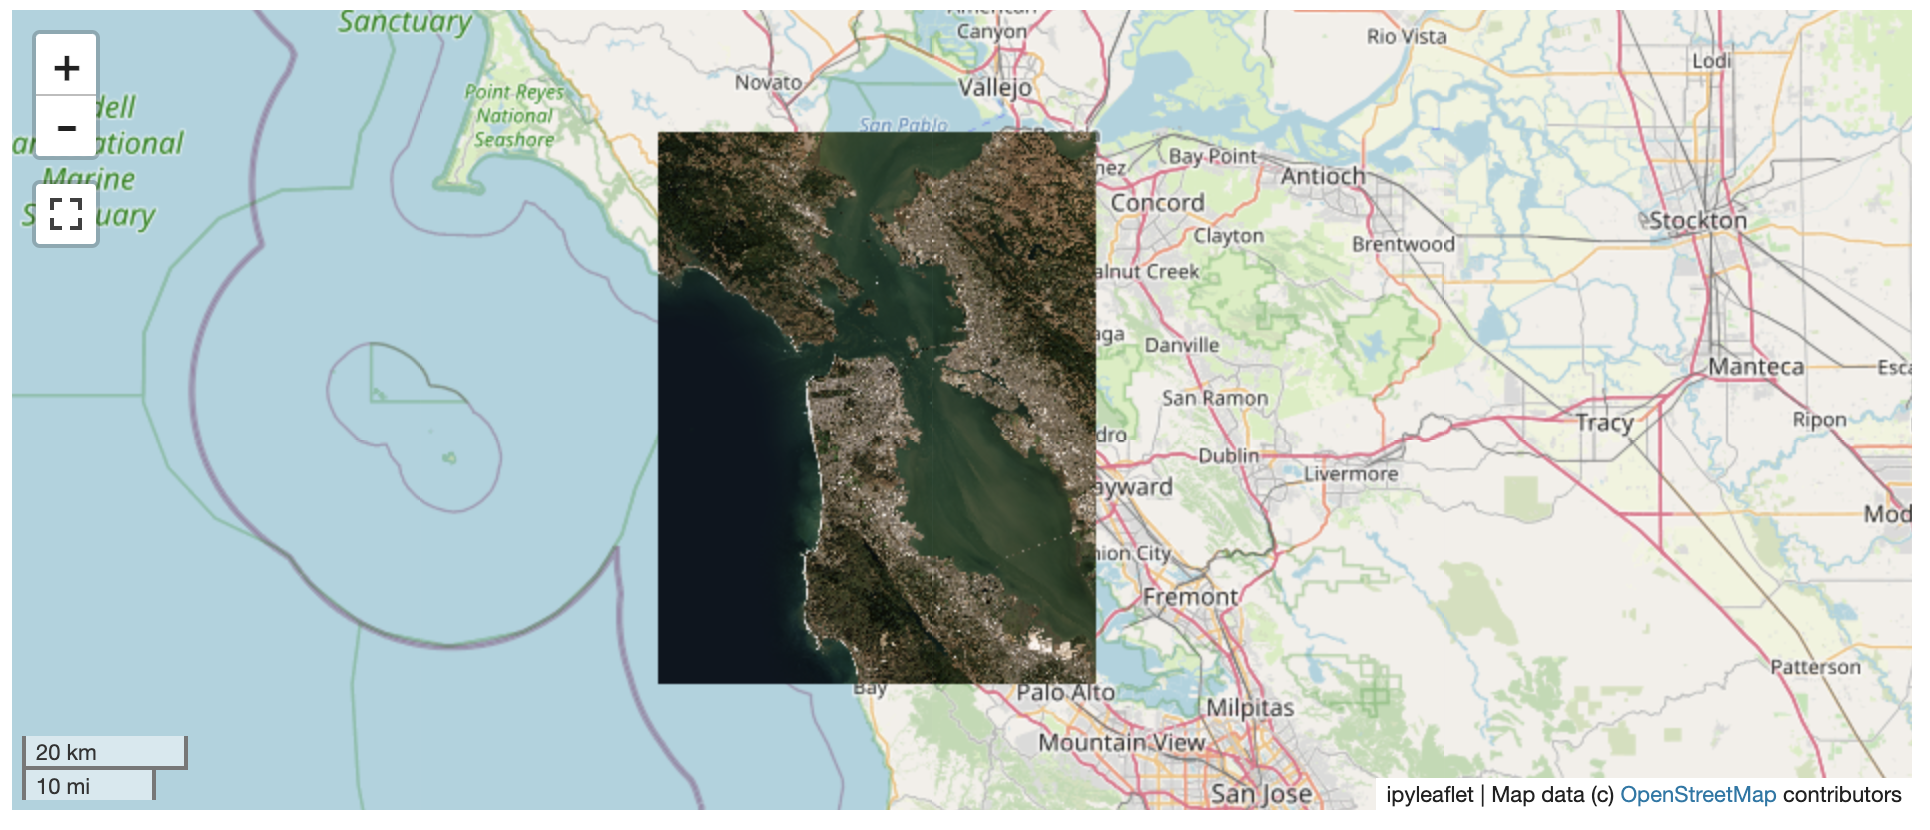
Compute derived imagery on the fly using band math expressions:
client = lts.open('path/to/multispectral.tif')

# NDVI: (NIR - Red) / (NIR + Red) where NIR=b4, Red=b1
t = lts.get_leaflet_tile_layer(client, expression='(b4-b1)/(b4+b1)',
vmin=-1, vmax=1, colormap='RdYlGn')Visualize assets from STAC catalogs:
import requests

# Fetch tiles from a STAC item's assets
resp = requests.get('http://localhost:PORT/api/stac/tiles/10/512/512.png',
                    params={'url': 'https://example.com/stac/item.json',
'assets': 'visual'})Serve tiles directly from xarray DataArrays (NetCDF, Zarr, etc.):
import xarray as xr

ds = xr.open_dataset('temperature.nc')
da = ds['temperature']
da = da.rio.write_crs('EPSG:4326')

# Register and serve tiles through the REST APIlocaltileserver works out of the box in JupyterLab, Notebook 7, JupyterHub,
and Binder because those frontends let the browser reach the jupyter-server
origin directly. VS Code Jupyter (including Remote-SSH), Google Colab, Shiny
for Python, Solara, and marimo render notebook outputs in a sandboxed webview
whose origin is not the jupyter-server — so root-relative tile URLs never
reach the proxy, and http://127.0.0.1:<port>/… fails to resolve.
To cover those frontends, localtileserver integrates with
jupyter-loopback. When
you call get_leaflet_tile_layer(...) or get_folium_tile_layer(...), the
helper automatically routes that client's tile URLs through the comm bridge.
No install step or notebook changes required — jupyter-loopback[comm] is
pulled in by the core pip install localtileserver.
If you use a TileClient outside those helpers (e.g. embedding raw tile
URLs in a custom HTML output), call the method explicitly:
client = lts.open('path/to/geo.tif')
client.enable_jupyter_loopback()
Or, for a specific port you're managing yourself:
import localtileserver
localtileserver.enable_jupyter_loopback(port)
Opt out globally by setting LOCALTILESERVER_DISABLE_JUPYTER_LOOPBACK=1 in
your environment before importing localtileserver.
The TileClient class can be used to launch a tile server in a background
thread which will serve raster imagery to a viewer (usually ipyleaflet or
folium in Jupyter notebooks).
This tile server can efficiently deliver varying resolutions of your raster imagery to your viewer; it helps to have pre-tiled, Cloud Optimized GeoTIFFs (COGs).
There is an included, standalone web viewer leveraging CesiumJS.
The server exposes a comprehensive REST API built on FastAPI:
| Endpoint | Description |
|---|---|
GET /api/tiles/{z}/{x}/{y}.{fmt} |
Raster tiles |
GET /api/thumbnail.{fmt} |
Thumbnail preview |
GET /api/metadata |
Raster metadata |
GET /api/bounds |
Geographic bounds |
GET /api/statistics |
Per-band statistics |
GET /api/part.{fmt} |
Bounding box crop |
POST /api/feature.{fmt} |
GeoJSON mask extraction |
GET /api/stac/tiles/{z}/{x}/{y}.{fmt} |
STAC item tiles |
GET /api/xarray/tiles/{z}/{x}/{y}.{fmt} |
Xarray DataArray tiles |
GET /api/mosaic/tiles/{z}/{x}/{y}.{fmt} |
Mosaic tiles |
GET /swagger/ |
Interactive API docs |
All tile/thumbnail endpoints support expression, stretch, indexes, colormap, vmin, vmax, and nodata query parameters.
Get started with localtileserver to view rasters in Jupyter or deploy as your
own FastAPI application.
Conda makes managing localtileserver's dependencies across platforms quite
easy and this is the recommended method to install:
conda install -c conda-forge localtileserverIf you prefer pip, then you can install from PyPI: https://pypi.org/project/localtileserver/
pip install localtileserver
For xarray/DataArray support:
pip install localtileserver[xarray]
For Jupyter widget integration:
pip install localtileserver[jupyter]
For additional colormaps:
pip install localtileserver[colormaps]
Please share your thoughts and questions on the Discussions board. If you would like to report any bugs or make feature requests, please open an issue.
If filing a bug report, please share a scooby Report:
import localtileserver as lts
print(lts.Report())