feat: add rperf as optional flamegraph profiler backend#662
Open
sam-saffron-jarvis wants to merge 5 commits intoMiniProfiler:masterfrom
Open
feat: add rperf as optional flamegraph profiler backend#662sam-saffron-jarvis wants to merge 5 commits intoMiniProfiler:masterfrom
sam-saffron-jarvis wants to merge 5 commits intoMiniProfiler:masterfrom
Conversation
Adds rperf (https://github.com/ko1/rperf) as an optional alternative
to stackprof for generating flamegraphs in rack-mini-profiler.

## What

- New config option: `Rack::MiniProfiler.config.flamegraph_profiler`
  Values: `:auto` (default), `:stackprof`, `:rperf`
- New query param: `?pp=flamegraph&flamegraph_profiler=rperf`
- rperf output is converted to speedscope's native sampled profile
  format (rather than StackProf's format), since rperf's data maps
  directly to it (named frames, pre-computed ns weights).

## Why

rperf uses actual time deltas as sample weights to correct safepoint
bias — a fundamental limitation of signal-based profilers. In wall mode,
it also emits synthetic frames for [GVL blocked], [GVL wait], [GC
marking], and [GC sweeping], making GVL contention and GC overhead
directly visible in the flamegraph. This is not possible with stackprof.

## Constraints

- Requires rperf gem + Ruby >= 3.4.0
- `:auto` falls back to stackprof if rperf is not loaded, or rperf if
  stackprof is not loaded. Both present → prefers stackprof (existing
  behaviour unchanged).
- `flamegraph_ignore_gc` config has no effect with rperf (GC frames are
  always tracked, which is the better default).
- `flamegraph_sample_rate` config is reused but interpreted as Hz for
  rperf (vs. microsecond interval for stackprof). Defaults to 500 Hz.
Member
|
@ko1 adding rperf to rack-mini-profiler as an option ... any concerns here? (still need to carefully review PR and test... but it looks like an easy fit) |
…s nil store

- Update memcached service image: 1.6.9 → 1.6 (fixes Dalli 5.x meta protocol compat)
- Add Ruby 4.0 to CI matrix
- Change flush_tokens to use delete instead of set(nil) (nil value rejected by Dalli 5.x meta protocol)
Author
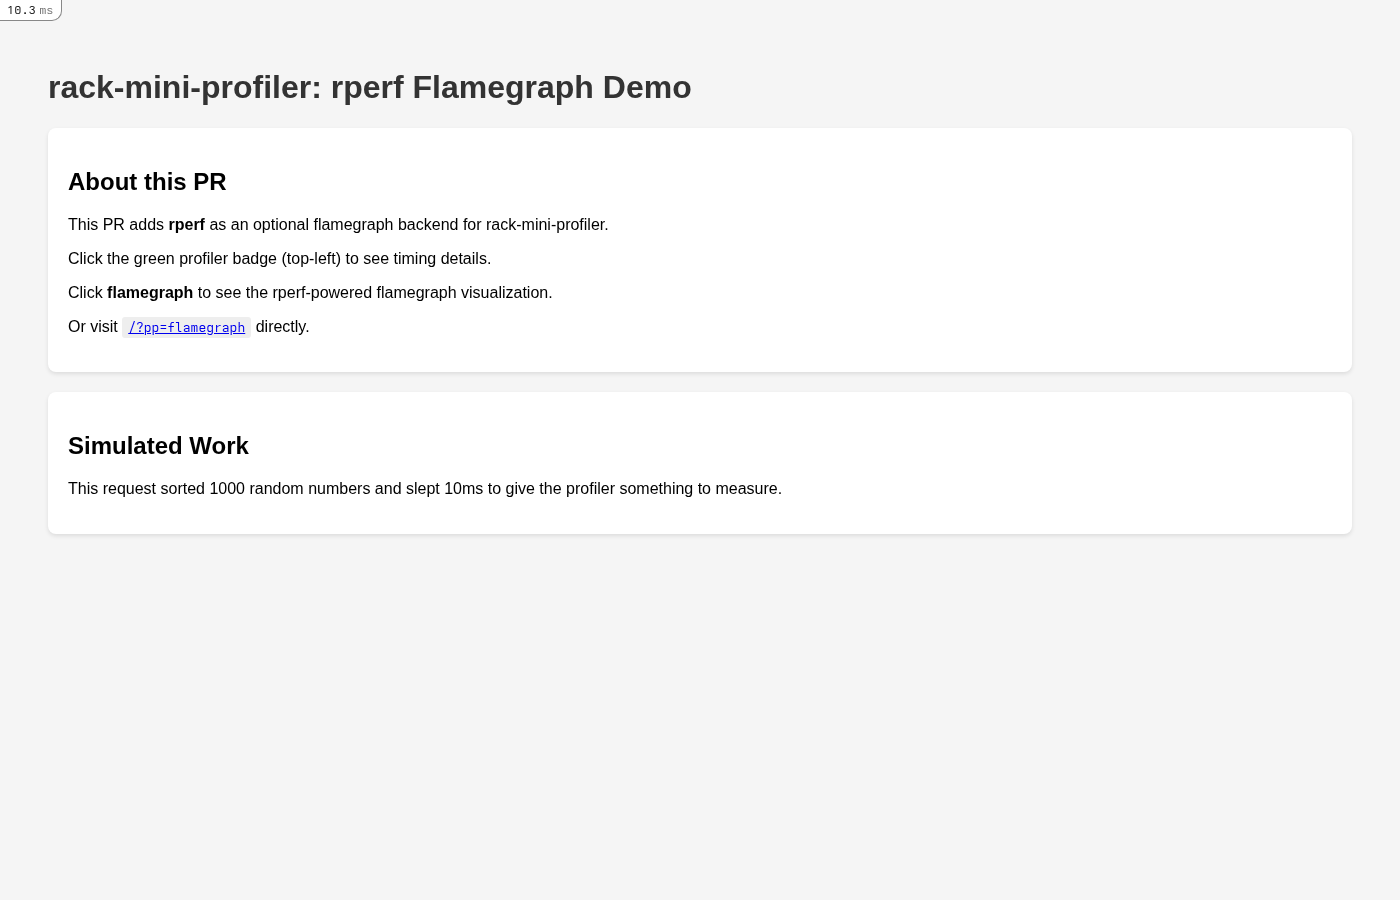
Screenshots — rperf flamegraph integration demoHere's what the integration looks like running locally on the MiniProfiler toolbar (top-left badge)
Expanded profiler view
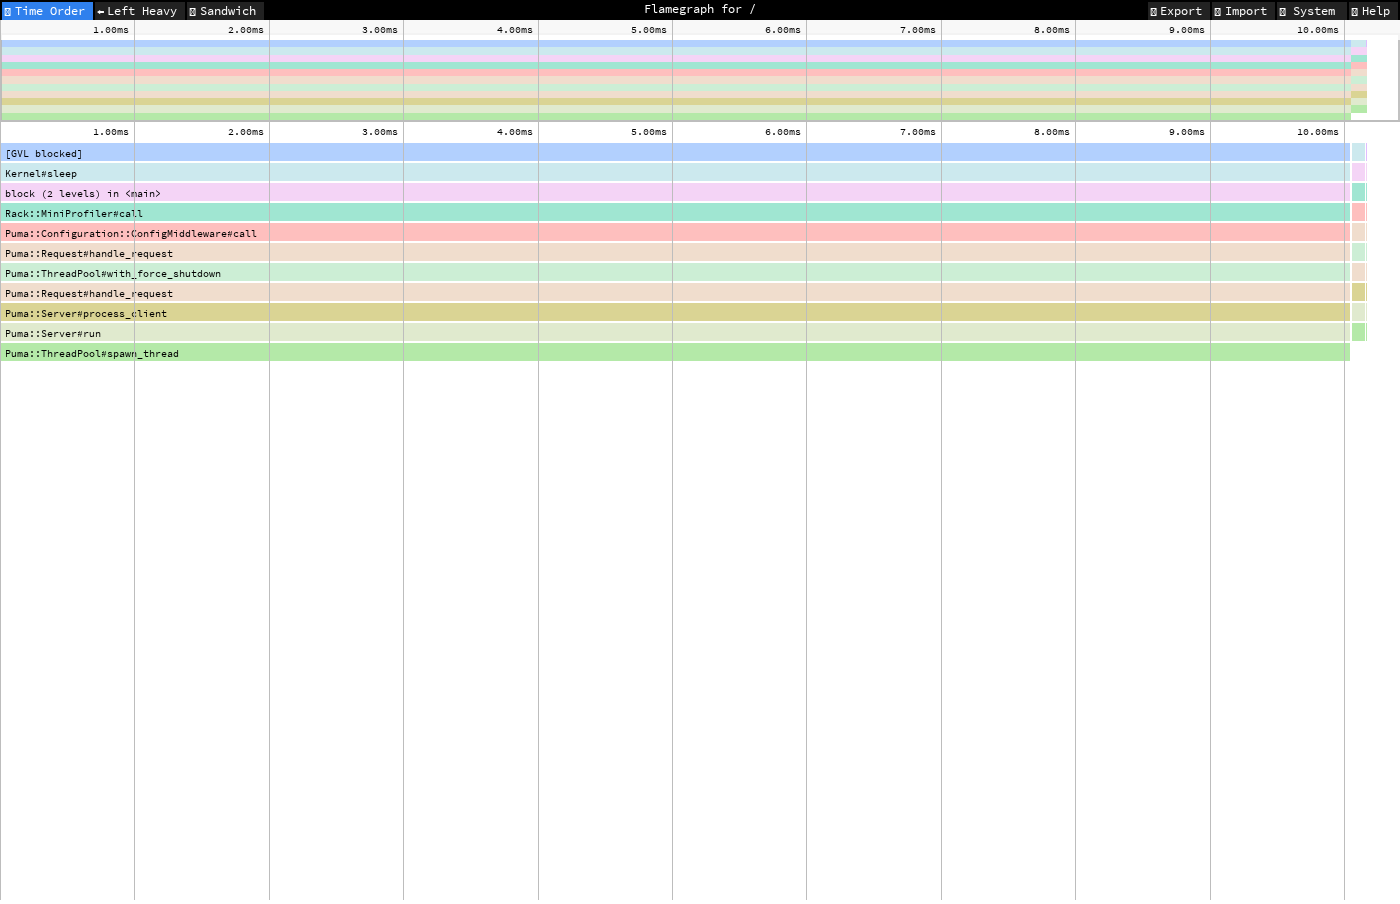
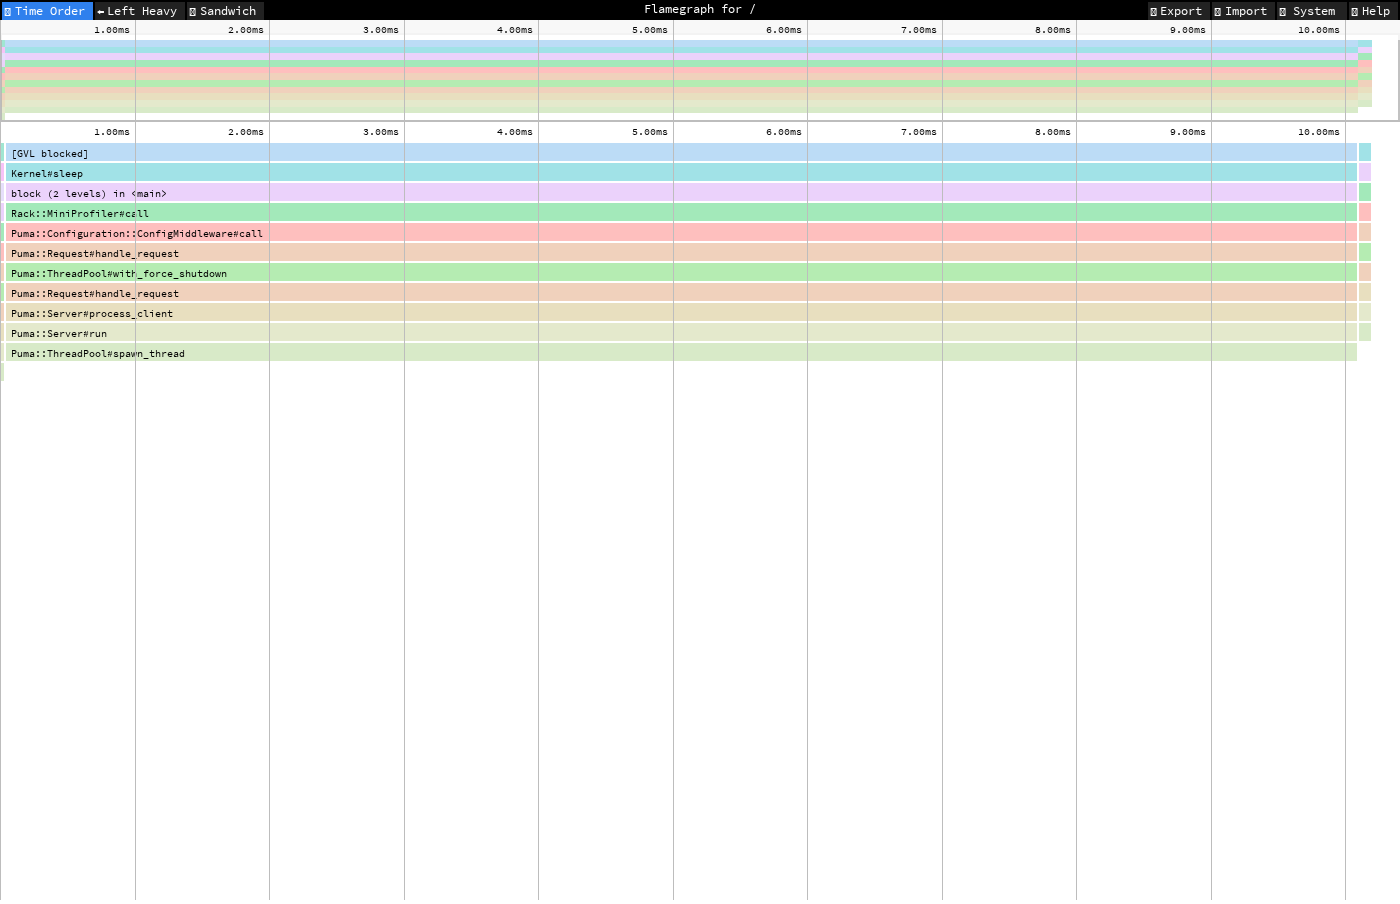
Flamegraph output (
|

|
I have no opinion. Please note that rperf is very young project and I can't keep compatibility, at least this year. |
This file contains hidden or bidirectional Unicode text that may be interpreted or compiled differently than what appears below. To review, open the file in an editor that reveals hidden Unicode characters.
Learn more about bidirectional Unicode characters
Sign up for free
to join this conversation on GitHub.
Already have an account?
Sign in to comment
3 participants
Add this suggestion to a batch that can be applied as a single commit.This suggestion is invalid because no changes were made to the code.Suggestions cannot be applied while the pull request is closed.Suggestions cannot be applied while viewing a subset of changes.Only one suggestion per line can be applied in a batch.Add this suggestion to a batch that can be applied as a single commit.Applying suggestions on deleted lines is not supported.You must change the existing code in this line in order to create a valid suggestion.Outdated suggestions cannot be applied.This suggestion has been applied or marked resolved.Suggestions cannot be applied from pending reviews.Suggestions cannot be applied on multi-line comments.Suggestions cannot be applied while the pull request is queued to merge.Suggestion cannot be applied right now. Please check back later.
What
Adds rperf as an optional alternative to stackprof for generating flamegraphs.
New config option:
Or per-request via query param:
?pp=flamegraph&flamegraph_profiler=rperfWhy rperf?
rperf uses actual time deltas as sample weights to correct safepoint bias — a fundamental limitation of signal-based profilers like stackprof. Samples at safepoints can be delayed, making expensive-but-rare code appear cheap. rperf compensates by weighting each sample by the actual elapsed time since the previous sample.
In wall mode, rperf also emits synthetic frames for non-CPU time:
[GVL blocked][GVL wait][GC marking][GC sweeping]These appear as real frames in the flamegraph, making GVL contention and GC overhead directly visible without additional tooling.
Implementation
rperf's output (named frame pairs + pre-computed ns weights) maps naturally to speedscope's native sampled profile format, so no intermediate translation to StackProf format is needed. Speedscope auto-detects the format via
$schema.The existing StackProf path is completely unchanged.
Constraints
gem 'rperf'+ Ruby >= 3.4.0:automode: prefers stackprof if loaded, falls back to rperf if only rperf is loadedflamegraph_ignore_gchas no effect with rperf (GC frames always tracked)flamegraph_sample_rateis reused as Hz for rperf (vs. ms interval for stackprof)