- Authors/Developers: Aust Kätzchen, Vis Tacitus
- E-mail: vf@confoederatio.org
- 📝 Methodological Paper (1.0.1): https://doi.org/10.5281/zenodo.17180328
- 📝 Methodological Paper (1.0): https://doi.org/10.5281/zenodo.17172245
Abstract.
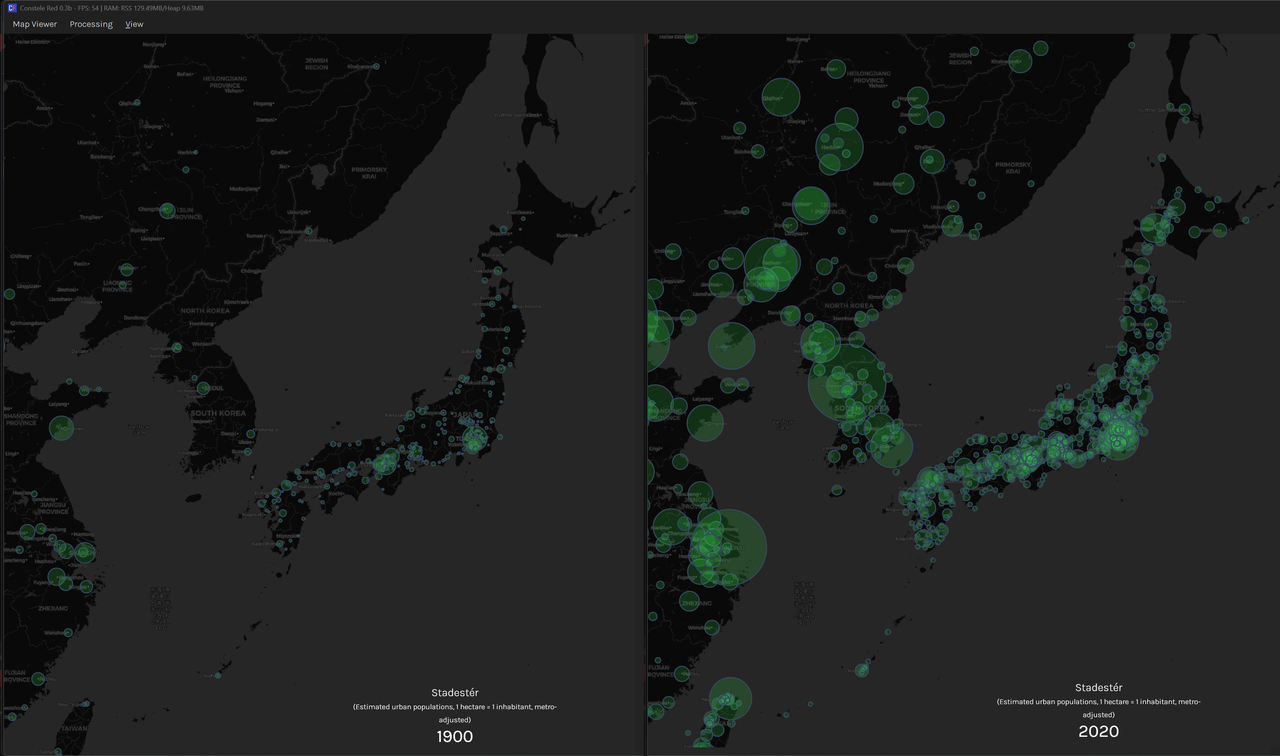
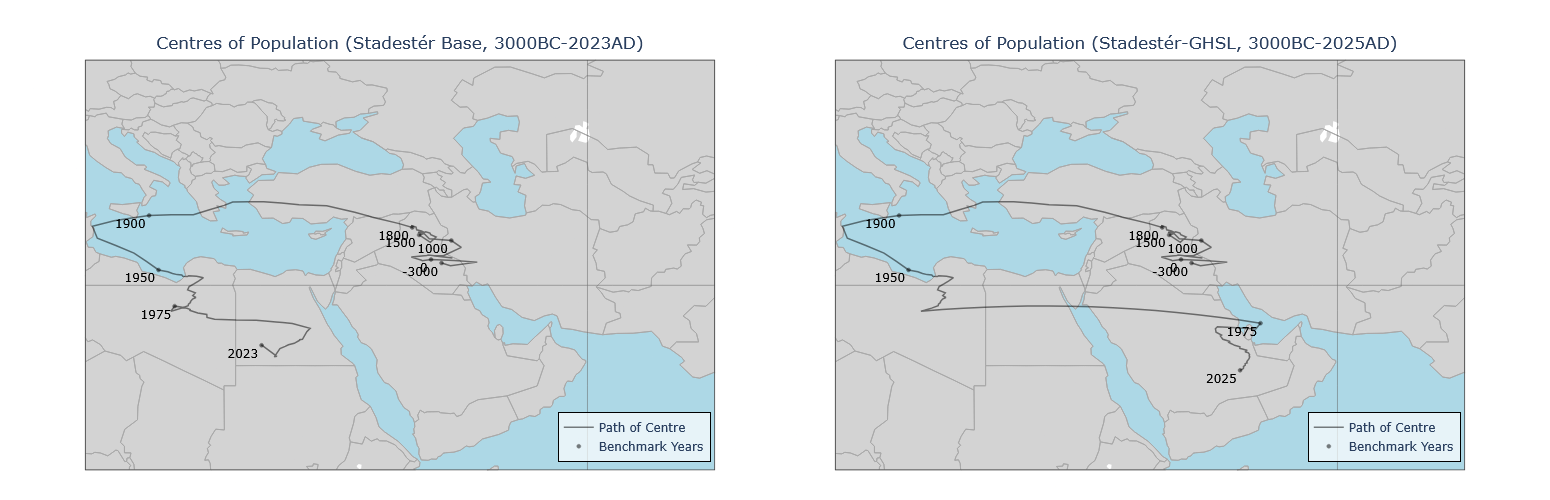
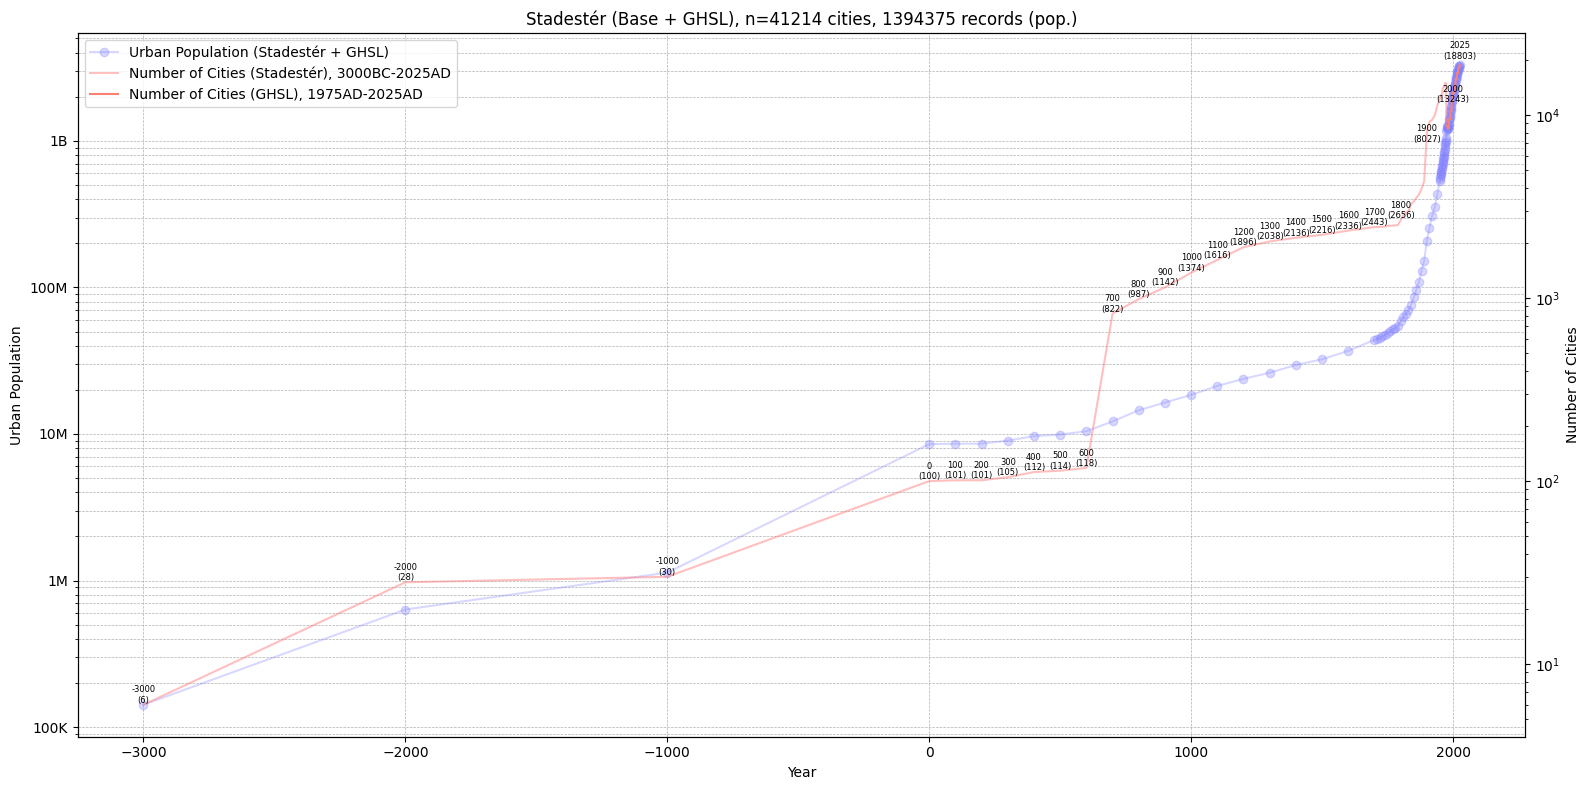
Stadestér is an urban population database of ~40k+ global cities and their populations from 3000BC to the present day as taken from Chandler, Modelski, Reba et al., Buringh, DeVries, Populstat, GHSL, and Wikipedia. Resultant demographic inormation was hybridised, standardised, geolocated, cubic spline interpolated, and calculated at 1-year intervals utilising geomean scalars and agglomerative correction techniques.
Area, density, RNI, and geospatial distributions of population within cities are also available at annual resolution starting from 1800AD. Note that rasters have only been outputted for the subset of HYDE years from 3000BC-2025AD, and that you must dynamically generate rasters outside of this subset via the provided CLI in autorun.bat. Rural, urban, and total population rasters at 5-arcmin resolution are available from 10000BC-2025AD at a global level.
To avoid double counting, metropolitan networks were corrected for in the data by subtracting suburban populations from their metro area, and redistributing any negative numbers held by the metropolitan area back to their suburbs in a proportional manner. Area/density calculations were derived from Angel (2011), Bairoch (1991), Clark (1951), Pasciuti and Chase-Dunn (2002), and Stanilov and Sykora (2014). Hanson and Ortman's work on classical populations have not yet been incorporated.
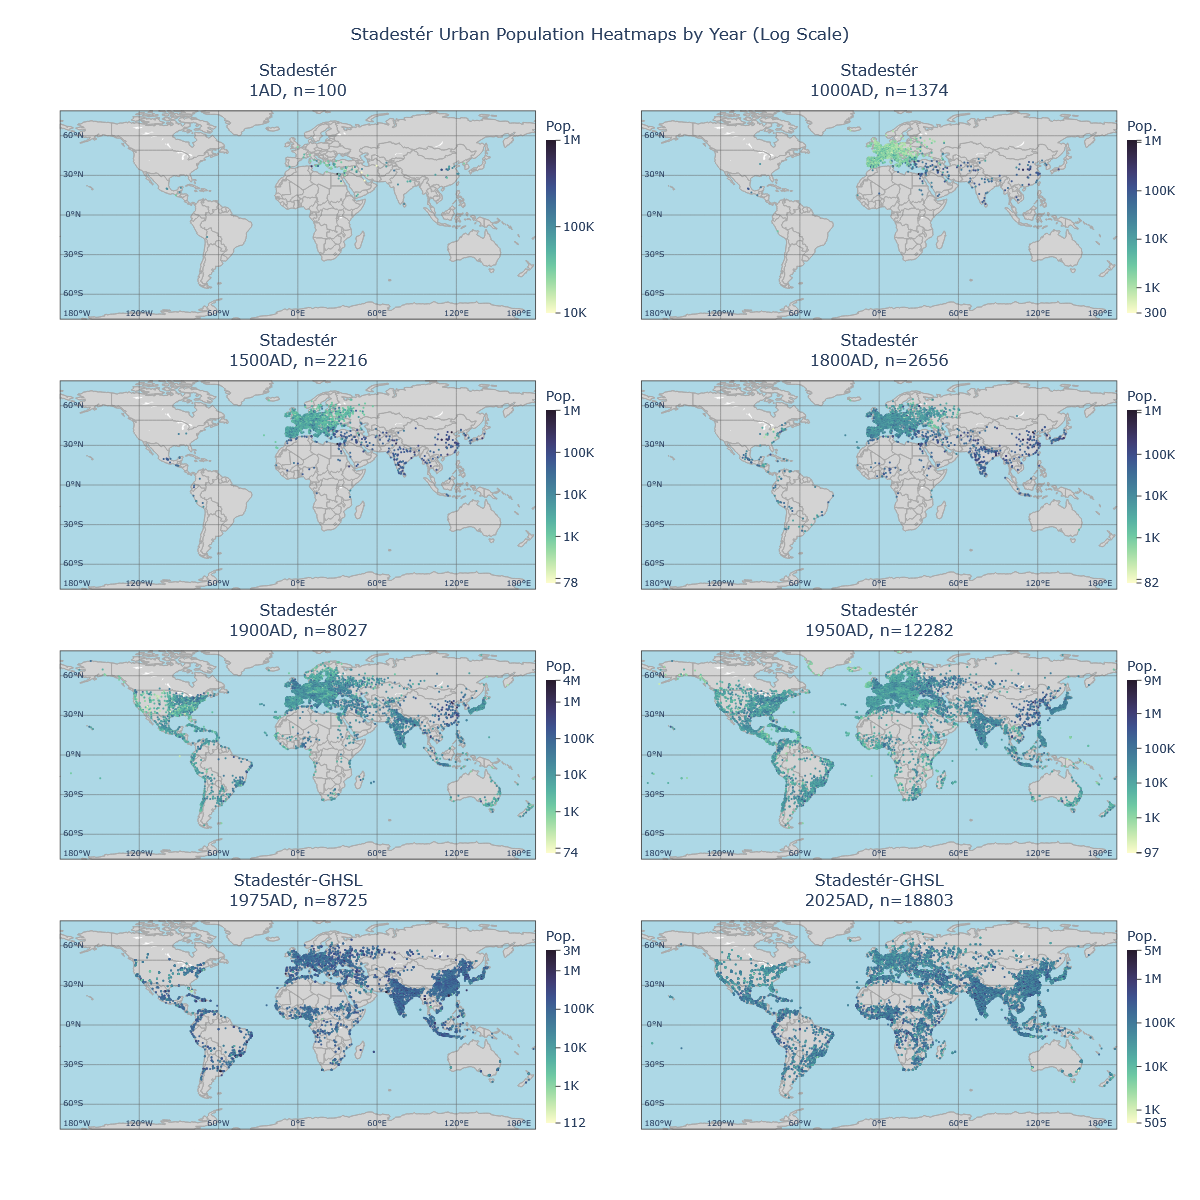
Two versions of Stadestér are provided: Stadestér Base (which does not merge Stadestér with GHSL post-1975), and Stadestér-GHSL (which utilises GHSL post-1975). There is additionally the option to generate a non-agglomerative corrected version from the CLI by calling console generateNonMetroCorrectedBase(). By comparison, console generateMetroCorrectedBase() generates the default corrected version of Stadestér.
Geospatial Distributions.
A substrata model was constructed from HYDE3.2/3.3 normalised to McEvedy and Jones (see Velkscala 0.7). Resultant rasters were subject to Moore neighbourhood outlier removal (threshold of 8x the average), with a fallback model constructed from KK10/LUH2 (Kaplan and Krumhardt 2010, Land Use Harmonisation 2) scaled to regional (Nelson, OWID) and global population estimates [1].
Spatiotemporal outlier masking was also performed for irregular regions, with manual copychecking done in Constele Red, our custom geospatial visualisation and preprocessing suite. Outliers masked for replacement by the fallback model were as follows:
- Athens: 10000BC-1000AD
- Bhutan: 10000BC-1500AD
- Canada: 10000BC-1750AD
- Denmark: 10000BC-1000BC
- Hong Kong: 10000BC-1850AD
- Milan, Naples: 10000BC-1000BC
- Russia: 10000BC-1400AD
- Siberia: 10000BC-1500AD
- St. Petersburg: 10000BC-1700AD
- Witwatersrand: 10000BC-1880AD
Custom demographic modelling was also done for pre-Columbian Northern America based on the work of Nevle and Bird, Milner and Chaplin, and Driver and Massey. CARD/p3k14c has not yet been incorporated, nor modelling for Amazonian/Siberian populations.
After 1975, GHS-POP was utilised as the substrata base instead. Annular rings were calculated from Clark, Stanilov and Sykora variant equations as to their radial density, with fractional per-pixel scaling and proportional distribution over the substrata. This sort of annular scaling is in effect an extended Burgess model that takes into account local land use, pre-existing population distributions, and existing coastlines, lakes, and land area.
Annular rings were decided to be at 5-arcminute resolution, like all resultant rasters. You can view intended Stadestér rasters/outputs in ./output/stadester/. Manual copychecking was performed for Stadestér results, and outliers or errant information was corrected via various injection stages throughout the pipeline.
Raw Datasets.
Raw dumps of demographic data, cleaned and refined, are available for the following sources:
- Buringh (Geolocated, Cleaned)
- Chandler (Geolocated, Cleaned)
- DeVries (Geolocated, Cleaned)
- GHSL (Geolocated, Cleaned)
- GHS-POP (Geolocated, Cleaned)
- Modelski (Geolocated, Cleaned)
- Populstat (Geolocated, Cleaned)
- Wikipedia (Geolocated, Extracted)
- Worldcitypop (Geolocated, Cleaned)
This repository is currently in production and may be subject to frequent updates. Stadestér is a sub-project of both Eoscala and Velkscala.
Footnotes.
[1] Woytinski and Woytinski 1950, Winkler-Prins 1950, Clark 1967 Lower, Clark 1967 Upper, Tuve 1970, Winkler Prins 1970, McEvedy and Jones 1978, Durand 1974 Lower, Durand 1974 Upper, Durand 1977 Lower, Durand 1977 Upper, McEvedy and Jones 1978, Biraben 1980, Richards 1980, Griger 1980, Merrick et al. 1986, Eric 1987, Bogue 1985, Demeny 1988, Stern K. 1990, United Nations 1990, WRI 1990, Kapitsa 1997, Liu and Jiang 1997, Kremer 1993, Klein Goldewijk and Battjes 1995, Maddison 2001, PRB 1973-2016, HYDE 2010-2020, UN 2015, UN 2019-2023, US Census Bureau 2017, Macrotrends 2025, and Gapminder were principally used as the main sources of estimation for global population over the long run, subject to geometric mean merging over their respective domains.