You signed in with another tab or window. Reload to refresh your session.You signed out in another tab or window. Reload to refresh your session.You switched accounts on another tab or window. Reload to refresh your session.Dismiss alert
{{ message }}
This repository was archived by the owner on May 9, 2023. It is now read-only.
I have implemented the widget and works fine. Only 1 issue (for me) which I am not able to get solved. Maybe you can help out.
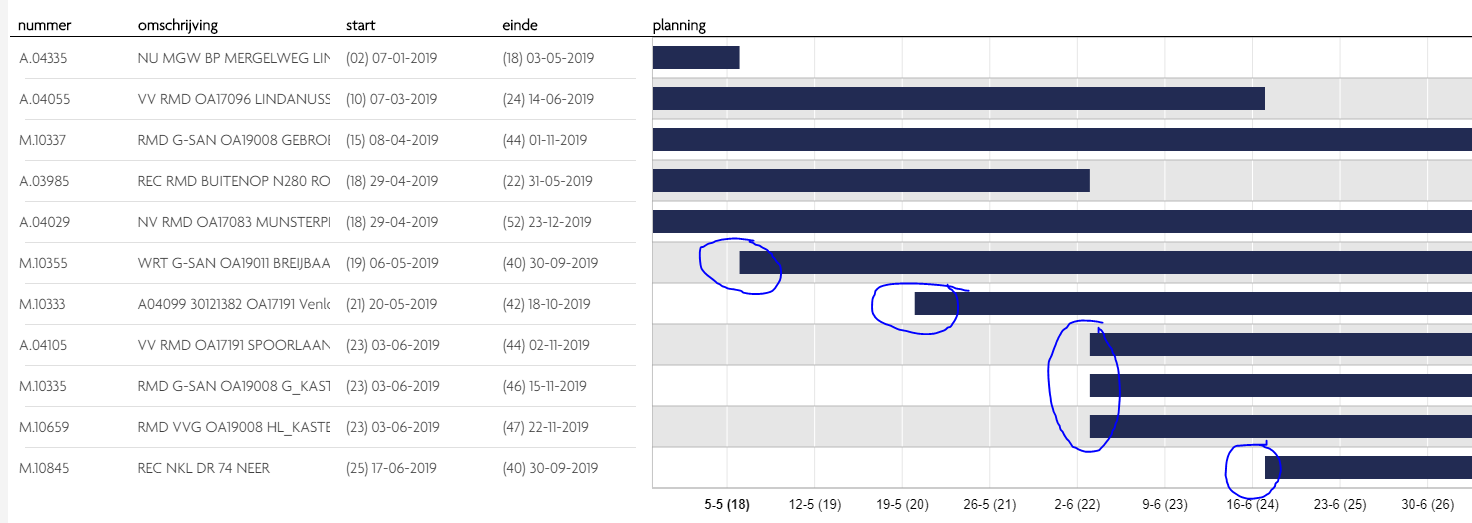
As you can see in the attachement, I am showing weeks. To make it better to understand I have also added the date. My weeks run from Monday 00:00:00 to Sunday 23:59:59. The data is shown correct in the timeline. My issue is that vertical lines are placed on the sundays in stead of monday.
I alreay tried the following to solve it:
Chart option 'Locale' is set to 'nl'
Mendix setting 'Language' is also set to 'Dutch'
Mendix setting 'First day of the week' set to 'Monday' in stead of Default (based on locale)
Hi Jelle,
I have implemented the widget and works fine. Only 1 issue (for me) which I am not able to get solved. Maybe you can help out.
As you can see in the attachement, I am showing weeks. To make it better to understand I have also added the date. My weeks run from Monday 00:00:00 to Sunday 23:59:59. The data is shown correct in the timeline. My issue is that vertical lines are placed on the sundays in stead of monday.
I alreay tried the following to solve it:
Unfortunately nothing seems to work.
Can you help out here?
Thanks in advance.
Regards, Roel van Loon