Hi there,
I am having trouble understanding color gradient when using denmap =T.
(1) I see some portion of linkage maps with no markers but color changes as you can see in the figure below. If we consider LG4, I do not have any markers between ~13 cM and ~40 cM, if the function smoothes out the density then I should observe a dark blue in the middle of no marker area (around 27 cM) which fades away on both direction. Instead, I see I small light-colored sliding window between darker blue on both side:
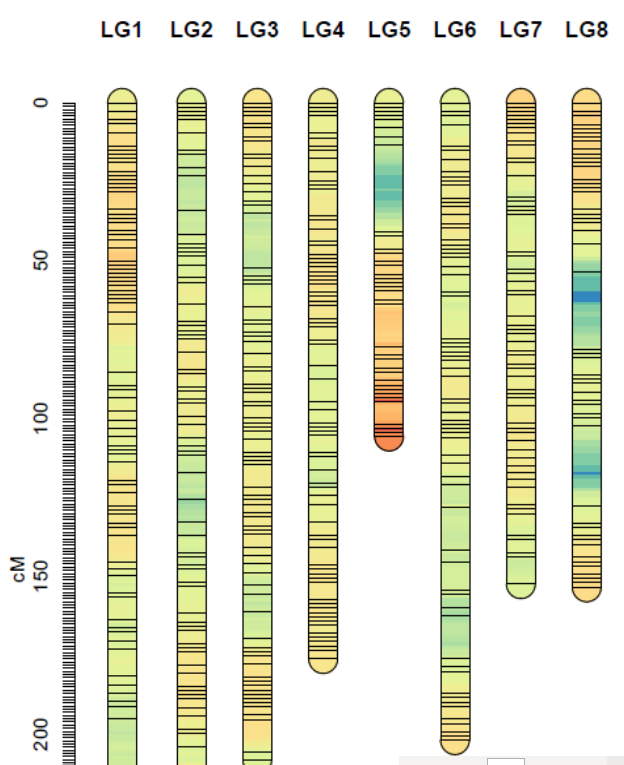
Could you please explain how this denmap function works and why the center part of the no marker area is not coded as the darkest blue?
(2) Is there a way to generate similar output as of denmap=T argument where no marker labels or the position has labeled on linkage group instead just white vertical chromosome outline with horizontal bars of markers, WHEN denmap=F argument is used?
By the way, I read the previous issue, and I can confirm that one of the reviewer in my manuscript raised the concerns over color smoothening and if density can be expressed as locus/cM instead of default cM/locus. Something to consider if you are working on adding new features.
Thank you so much for your time,
-Prashant

Hi there,
I am having trouble understanding color gradient when using denmap =T.
(1) I see some portion of linkage maps with no markers but color changes as you can see in the figure below. If we consider LG4, I do not have any markers between ~13 cM and ~40 cM, if the function smoothes out the density then I should observe a dark blue in the middle of no marker area (around 27 cM) which fades away on both direction. Instead, I see I small light-colored sliding window between darker blue on both side:
Could you please explain how this denmap function works and why the center part of the no marker area is not coded as the darkest blue?
(2) Is there a way to generate similar output as of denmap=T argument where no marker labels or the position has labeled on linkage group instead just white vertical chromosome outline with horizontal bars of markers, WHEN denmap=F argument is used?
By the way, I read the previous issue, and I can confirm that one of the reviewer in my manuscript raised the concerns over color smoothening and if density can be expressed as locus/cM instead of default cM/locus. Something to consider if you are working on adding new features.
Thank you so much for your time,
-Prashant